
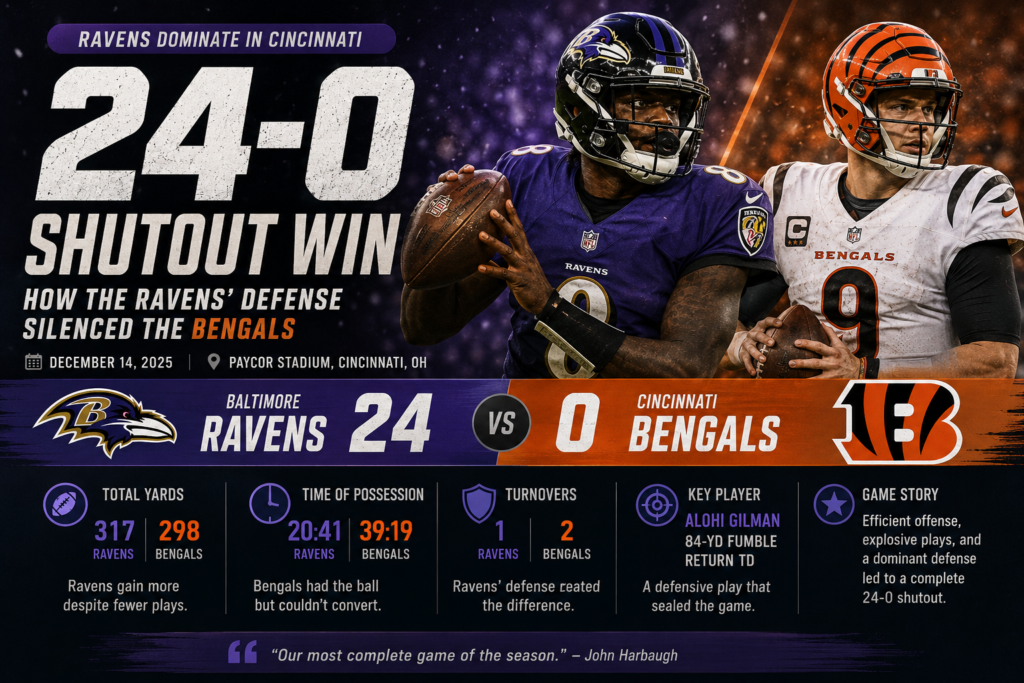
A 24-0 final score usually tells a simple story: one team dominated, the other failed to score. But the Bengals vs Baltimore Ravens match player stats from December 14, 2025, tell a more complicated story — Cincinnati actually held advantages in possession and first downs, while Baltimore won the moments that mattered most.
The Ravens turned 317 yards, 189 rushing yards and two defensive takeaways into a shutout victory at Paycor Stadium, while Joe Burrow and the Bengals repeatedly moved the ball without converting those opportunities into points.
Team Comparison: Ravens vs Bengals
| Statistic | Baltimore Ravens | Cincinnati Bengals |
|---|---|---|
| Final score | 24 | 0 |
| Total yards | 317 | 298 |
| First downs | 15 | 18 |
| Rushing yards | 189 | 100 |
| Passing yards, net | 128 | 198 |
| Offensive plays | 40 | 71 |
| Average yards/play | 7.9 | 4.2 |
| Third down | 2/7 (28.6%) | 3/15 (20.0%) |
| Fourth down | 0/0 | 3/5 (60.0%) |
| Red zone | 0/1 | 0/1 |
| Turnovers | 1 | 2 |
| Sacks allowed | 3 | 4 |
| Penalties | 2-10 | 4-30 |
| Time of possession | 20:41 | 39:19 |
| Touchdowns | 3 | 0 |
The strange-looking part of this table is Cincinnati’s 39:19 time of possession and 18 first downs. The Bengals had the ball for almost twice as long as Baltimore, yet the Ravens produced the only points. That is a useful reminder that possession statistics describe opportunity, not necessarily efficiency.
Final Score and Game Context
The Baltimore Ravens defeated the Cincinnati Bengals 24-0 on Sunday, December 14, 2025, at Paycor Stadium in Cincinnati. The official gamebook lists an attendance of 64,907 and a game time of 2 hours, 52 minutes.
The weather was a major part of the setting. The Bengals described it as the coldest game at Paycor Stadium in 25 years, with temperatures around 10 degrees Fahrenheit and a wind chill of minus one degree at kickoff.
This was also a particularly meaningful AFC North rematch. Cincinnati had beaten Baltimore 32-14 on Thanksgiving night, with Joe Burrow throwing for 261 yards in his return from injury. Three weeks later, Baltimore reversed the result emphatically.
The win moved Baltimore to 7-7, while Cincinnati fell to 4-10 and was eliminated from playoff contention. The Ravens also kept themselves alive in the AFC North race.
Baltimore Ravens Offensive Performance
Lamar Jackson
Lamar Jackson completed 8 of 12 passes for 150 yards, two touchdowns and one interception, producing a 114.6 passer rating. He also ran twice for 26 yards, including a 14-yard gain.
The efficiency mattered more than the low passing volume. Jackson attempted only 12 passes, but Baltimore averaged 12.5 yards per completion and generated touchdown passes to Rasheen Ali and Zay Flowers. His interception came when a pass deflected off a dropped ball by Flowers, rather than from a conventional clean interception.
Jackson was also pressured by Cincinnati’s front. The Bengals recorded four sacks according to the official individual defensive statistics, with Demetrius Knight Jr. and Myles Murphy each recording two.
Derrick Henry
Derrick Henry ran 11 times for 100 yards, averaging 9.1 yards per carry, with a long run of 29 yards.
That was one of the clearest reasons Baltimore could remain so dangerous despite running only 40 offensive plays. Henry averaged almost ten yards every time he carried the ball, helping Baltimore finish with 189 rushing yards on 24 attempts. The official Ravens recap specifically highlighted that Henry reached 100 yards on just 11 carries.
Keaton Mitchell
Keaton Mitchell added 66 rushing yards on eight attempts, an excellent 8.3-yard average, with a long of 22 yards.
Mitchell’s production made Baltimore’s rushing attack more than a Derrick Henry story. The Ravens repeatedly created efficient gains on the ground, finishing with 189 rushing yards compared with Cincinnati’s 100.
Zay Flowers
Zay Flowers caught three passes for 68 yards and a touchdown, averaging 22.7 yards per catch. His longest reception was the 28-yard touchdown that gave Baltimore a 14-0 halftime lead.
His impact was concentrated into a few plays. Flowers also made a 26-yard catch on the decisive five-play, 80-yard drive late in the second quarter. Those two catches helped transform a scoreless first half into a 14-point Baltimore advantage before halftime.
Rasheen Ali
Rasheen Ali caught two passes for 32 yards and a touchdown, including the 30-yard touchdown reception that opened the scoring.
It was Ali’s first career touchdown and came on third down. The play was valuable because Baltimore had not generated points during the opening quarter, and the 30-yard catch immediately changed the scoreboard.
DeAndre Hopkins and Mark Andrews
DeAndre Hopkins had one catch for 32 yards, while Mark Andrews caught two passes for 18 yards. Hopkins’ 32-yard reception was Baltimore’s longest non-touchdown catch.
Baltimore did not need a high-volume passing distribution. Jackson completed only eight passes, but those completions produced 150 gross passing yards.
Cincinnati Bengals Offensive Performance
Joe Burrow
Joe Burrow completed 25 of 39 passes for 225 yards, with zero touchdowns and two interceptions. His passer rating was 58.2, while ESPN lists his QBR at 17.3.
The yardage alone does not explain the problem. Burrow produced 225 passing yards, but Baltimore forced him into mistakes in critical situations. ESPN reported that Burrow was only 4-for-10 for 59 yards with two interceptions when under pressure.
The second interception became the game’s most damaging play. With Cincinnati inside Baltimore’s 10-yard line in the fourth quarter, Burrow was pressured by Tavius Robinson and threw an interception to Kyle Van Noy. Van Noy lateraled the ball to Alohi Gilman, who returned it the remaining 84 yards for a touchdown.
Ja’Marr Chase
Ja’Marr Chase was easily Cincinnati’s biggest statistical producer. He caught 10 passes for 132 yards, averaging 13.2 yards per reception, with a long of 34 yards.
Yet Chase’s huge receiving line produced no points. His performance is one of the clearest examples of why raw yardage cannot be used alone to explain an NFL result.
Chase also reached 100 receptions for the season during the game. The Bengals noted that it was his 16th career game with at least 10 catches and that his ninth reception gave him his 100th catch of the season.
Chase Brown
Chase Brown rushed 13 times for 53 yards, averaging 4.1 yards per carry. He also caught seven passes for 37 yards.
Brown’s combined contribution gave Cincinnati some offensive movement, but Baltimore prevented the Bengals’ running game from producing the kind of explosive efficiency Henry and Mitchell generated.
Samaje Perine
Samaje Perine carried 14 times for 42 yards, a 3.0-yard average, and caught one pass for one yard.
The Bengals therefore had volume but not enough efficiency on the ground. Cincinnati ran 29 rushing plays for 100 yards, while Baltimore generated 189 yards on 24 attempts.
Passing and Defensive Unit Performance
Since football does not have pitching, the closest equivalent is the matchup between the passing games and the opposing defensive units.
| Unit | Baltimore Ravens | Cincinnati Bengals |
|---|---|---|
| Passing yards | 150 gross / 128 net | 225 gross / 198 net |
| TD passes | 2 | 0 |
| Interceptions thrown | 1 | 2 |
| Sacks | 3 | 4 |
| Takeaways | 2 | 1 |
| Defensive TDs | 1 | 0 |
| Total team sacks credited | 3 | 4 |
The Bengals’ pass rush actually had the stronger sack total, but Baltimore’s defense generated the more valuable plays. The Ravens intercepted Burrow twice, and the second became a 95-yard combined interception return for a touchdown.
There is a small source discrepancy worth preserving rather than hiding: Baltimore’s team recap lists four sacks for the Ravens, while the official NFL gamebook and individual defensive statistics credit Baltimore with three sacks of Burrow. For a publishable statistical article, the official gamebook figure of three should be used.
Ravens Defensive Standouts
Alohi Gilman recorded eight tackles and scored the defensive touchdown after receiving Van Noy’s interception. His 84-yard return was the finishing part of the 95-yard interception return sequence.
Kyle Van Noy intercepted Burrow for 11 return yards. The interception itself was important; the later exchange with Gilman made it devastating.
Marlon Humphrey added the Ravens’ other interception, returning it 21 yards.
Tavius Robinson returned from a seven-game absence and recorded a sack plus three quarterback hits. His pressure on the fourth-quarter interception was particularly significant.
Bengals Defensive Standouts
Demetrius Knight Jr. recorded two sacks, the first two sacks of his NFL career.
Myles Murphy also recorded two sacks, making it his first career multi-sack game.
Jordan Battle intercepted Lamar Jackson once, giving him four interceptions on the season.
That is why the Bengals’ defensive statistics should not be dismissed simply because the team lost 24-0. Cincinnati’s defense created pressure and intercepted Jackson, but Baltimore’s offense made better use of its limited possessions.
Key Turning Points
1. First quarter: Cincinnati’s defense holds
Cincinnati recorded early pressure on Jackson, with Knight and Murphy eventually contributing sacks. The Bengals were able to keep Baltimore scoreless through the opening quarter.
At that stage, the game looked nothing like a 24-0 result.
2. 4:35 left in the second: Ali breaks the deadlock
Jackson found Rasheen Ali for a 30-yard touchdown, completing a five-play, 79-yard drive. Baltimore finally had a 7-0 lead.
3. 23 seconds before halftime: Flowers makes it 14-0
Baltimore then produced another explosive drive. Flowers caught a 26-yard pass and later hauled in a 28-yard touchdown, giving the Ravens a two-score advantage with only 23 seconds remaining in the half.
That was probably the most important offensive sequence of the game.
4. Third quarter: Tyler Loop extends the lead
Tyler Loop hit a 27-yard field goal at 9:05 of the third quarter after a six-play, 60-yard possession. Baltimore led 17-0.
5. Fourth quarter: the knockout punch
Cincinnati finally drove deep into Baltimore territory and reached the Ravens’ 7-yard line. Instead of cutting the deficit, Burrow was intercepted by Van Noy, who lateraled to Gilman.
Gilman ran the remaining 84 yards for the touchdown, turning a potential Cincinnati scoring opportunity into a 24-0 Baltimore lead.
Why Baltimore Won
- Explosive rushing efficiencyBaltimore gained 189 rushing yards on only 24 attempts. Henry averaged 9.1 yards per carry and Mitchell 8.3. That efficiency kept the Ravens ahead of the chains.
- Jackson made limited opportunities countJackson threw only 12 passes but produced 150 yards and two touchdowns. Baltimore did not need sustained passing volume to score.
- The defense won the red-zone momentsCincinnati reached Baltimore territory multiple times but never converted its only official red-zone opportunity. Baltimore also finished 0-for-1 in the red zone, but its touchdowns came from explosive plays outside conventional goal-to-go situations.
- Turnovers changed the value of possessionBaltimore forced two interceptions while Cincinnati forced one. The Ravens’ second interception directly became a touchdown.
- Baltimore won the efficiency battleThe Ravens ran only 40 offensive plays compared with Cincinnati’s 71, yet gained 317 yards. Their 7.9 yards per play dwarfed Cincinnati’s 4.2.
Why Cincinnati Lost
- Possession did not become pointsCincinnati controlled the ball for 39:19 and produced 18 first downs, but the scoreboard remained at zero.
- Third-down efficiency was poorThe Bengals converted only 3 of 15 third downs, a 20% rate. That made long possessions difficult to finish.
- Burrow’s interceptions came at damaging timesTwo interceptions were not merely statistical turnovers. The second arrived during Cincinnati’s best fourth-quarter scoring opportunity and became Baltimore’s defensive touchdown.
- The running game lacked Baltimore’s explosivenessCincinnati averaged 3.4 yards per rushing attempt compared with Baltimore’s 7.9.
- Ja’Marr Chase’s production never reached the scoreboardChase had 132 receiving yards, but Cincinnati could not turn those catches into touchdowns or field goals. That made his excellent individual performance largely disconnected from the final result.
Player Comparison: Top Performers
| Player | Team | Key stat line | Main impact |
|---|---|---|---|
| Lamar Jackson | BAL | 8/12, 150 yards, 2 TD, 1 INT | Efficient explosive passing |
| Derrick Henry | BAL | 11 carries, 100 yards | Dominant rushing efficiency |
| Zay Flowers | BAL | 3 rec, 68 yards, TD | Two major second-half points-setting plays |
| Alohi Gilman | BAL | 8 tackles, 84-yard TD return | Defensive touchdown |
| Joe Burrow | CIN | 25/39, 225 yards, 2 INT | Yardage without scoring |
| Ja’Marr Chase | CIN | 10 rec, 132 yards | Cincinnati’s leading offensive weapon |
| Chase Brown | CIN | 13 rush, 53 yards; 7 rec, 37 yards | Combined offensive workload |
| Demetrius Knight Jr. | CIN | 2 sacks | Strong pressure performance |
| Myles Murphy | CIN | 2 sacks | Consistent pressure on Jackson |
| Jordan Battle | CIN | 1 INT | Created a Baltimore turnover |
The table shows the game’s central contradiction. Cincinnati produced several excellent individual performances, but Baltimore’s best players had greater influence on the scoring sequence.
The Standout Individual Performances
Derrick Henry’s 100 yards mattered more than Chase’s 132
At first glance, Chase’s 132 receiving yards look better than Henry’s 100 rushing yards. Chase gained more yards and caught 10 passes.
But Henry’s 100 yards came on only 11 carries.
That is 9.1 yards per carry, compared with Chase’s 13.2 yards per reception. More importantly, Henry’s rushing efficiency helped Baltimore gain 189 yards on 24 rushing attempts. Cincinnati had 100 rushing yards on 29 attempts.
This is why a box score needs context. A player can accumulate more total yardage and still have less control over the outcome than someone producing fewer yards at dramatically higher efficiency.
A 3-catch game can change everything
Flowers caught only three passes, compared with Chase’s 10. Yet two of Flowers’ catches were central to Baltimore’s 14-0 halftime advantage.
His 26-yard reception helped start the late second-quarter scoring drive, and his 28-yard touchdown finished it. The volume was low; the leverage was high.
That is the broader lesson from the Bengals vs Baltimore Ravens match player stats: not all yards are created equal.
Passing/Defensive Matchup Comparison
| Category | Ravens | Bengals | Edge |
|---|---|---|---|
| Gross passing yards | 150 | 225 | Bengals |
| Net passing yards | 128 | 198 | Bengals |
| Passing TDs | 2 | 0 | Ravens |
| INTs thrown | 1 | 2 | Ravens |
| Rushing yards | 189 | 100 | Ravens |
| Yards/play | 7.9 | 4.2 | Ravens |
| Sacks credited | 3 | 4 | Bengals |
| Takeaways | 2 | 1 | Ravens |
| Defensive TDs | 1 | 0 | Ravens |
| Third-down rate | 28.6% | 20.0% | Ravens |
| Red-zone results | 0/1 | 0/1 | Even |
The irony is obvious: Cincinnati won the raw passing-yardage battle and recorded more sacks, but Baltimore won the game comfortably. The Ravens’ advantage came from efficiency, rushing production and turnover value rather than statistical volume.
Advanced Interpretation of the Numbers
A few simple derived figures make the game easier to understand. These are illustrative calculations, not predictive metrics.
Yards per offensive play
Baltimore:
317 yards ÷ 40 plays = 7.93 yards/play
Cincinnati:
298 yards ÷ 71 plays = 4.20 yards/play
That is a huge gap.
Baltimore gained roughly 3.7 more yards every time it ran an offensive play. Cincinnati had 31 more offensive plays, but Baltimore gained 19 more total yards.
Points per offensive play
Baltimore scored 24 points on 40 offensive plays:
24 ÷ 40 = 0.60 points/play
Cincinnati scored zero on 71 plays:
0 ÷ 71 = 0 points/play
This is not a predictive statistic. It simply illustrates how dramatically different the two offenses were at converting possessions into points on this specific afternoon.
Rushing efficiency
Baltimore:
189 ÷ 24 = 7.88 yards/carry
Cincinnati:
100 ÷ 29 = 3.45 yards/carry
The Ravens therefore generated more than twice Cincinnati’s rushing efficiency.
Turnover value
Baltimore committed one turnover and forced two.
Cincinnati committed two turnovers and forced one.
That gives Baltimore a +1 turnover margin.
The raw margin is modest, but the location of the second Cincinnati turnover made it much more valuable because it became a defensive touchdown.
Secondary Context: Defense, Field Position and Small Details
The Bengals actually had some special-teams advantages. Cincinnati recorded 110 kickoff-return yards, while Baltimore had 32. Cincinnati also had two more first downs and controlled possession for nearly 40 minutes.
None of that mattered because the Ravens repeatedly produced explosive plays.
Baltimore also committed only two penalties for 10 yards, while Cincinnati was flagged four times for 30 yards. That did not explain the entire 24-point gap, but it added to Baltimore’s cleaner performance.
The fourth-down numbers are also interesting. Cincinnati converted 3 of 5 fourth downs, showing that it was willing and able to extend possessions. But those extended drives still ended without points.
That is a classic example of why possession time should not be treated as synonymous with offensive dominance.
Broader Context: The Rematch Changed the Story
The December game was played only 17 days after Cincinnati’s Thanksgiving victory in Baltimore.
On November 27, the Bengals won 32-14, forced five Baltimore turnovers and watched Burrow throw for 261 yards in his return.
The rematch could hardly have been more different.
Baltimore committed only one turnover, forced two, held Cincinnati scoreless and produced the Ravens’ first shutout since 2018. ESPN also reported that it was the first time Burrow had been shut out in his six-year career as a starter.
For Baltimore, the victory snapped a two-game losing streak and represented a fourth consecutive road win. For Cincinnati, the loss eliminated the Bengals from playoff contention.
The two meetings therefore provide an unusually useful lesson: a matchup between the same teams can produce radically different statistical profiles only 17 days apart.
What These Stats Mean for Future Analysis
When reading a football box score like this one, start with five questions:
- Did the team generate yards efficiently?
- Did it convert third downs?
- Did it finish possessions with points?
- Where did the turnovers happen?
- Which individual plays actually changed the score?
For this game, those questions immediately point toward Baltimore.
Cincinnati had more possession, more first downs and more passing yards. Baltimore had the better yards-per-play figure, rushing efficiency, turnover margin and scoring efficiency.
That combination explains the final score much better than simply saying Baltimore “dominated.”
What Fantasy and Practical Readers Can Take From the Game
For fantasy analysis, Ja’Marr Chase’s 10 catches and 132 yards were obviously valuable in a receiving format even though Cincinnati lost. His 16 targets also show that he remained a major part of the Bengals offense.
Derrick Henry’s 100 rushing yards on 11 attempts demonstrate how much production can come from limited volume when efficiency is extreme.
Lamar Jackson’s fantasy line was efficient rather than volume-heavy: 150 passing yards, two passing touchdowns and 26 rushing yards. That distinction matters when evaluating future games because a 12-attempt passing workload is not automatically sustainable.
The practical lesson is simple: fantasy production and real-game influence are related, but they are not identical.
What the Box Score Does Not Tell You
A box score cannot fully explain why Cincinnati’s offense failed inside scoring range.
It cannot show every coverage adjustment, pressure disguise or route that forced Burrow to hold the ball. It cannot completely capture how the freezing conditions affected grip, footing and decision-making.
It also cannot tell you exactly how much one successful defensive adjustment changed the next series.
That is why the best statistical analysis combines the box score with play-by-play data and official team recaps. In this case, the combination shows that Baltimore’s defense did more than simply stop Cincinnati: it pressured Burrow at crucial moments and turned one of those moments directly into seven points.
How to Read a Box Score Like This: 7 Steps
1. Start with the score
The 24-0 result tells you the outcome, but not the mechanism.
2. Compare total yards
Baltimore had only a 19-yard advantage, so raw yardage alone cannot explain the game.
3. Look at plays and efficiency
The difference becomes obvious: Baltimore gained 7.9 yards per play compared with Cincinnati’s 4.2.
4. Check rushing efficiency
The Ravens averaged 7.9 yards per rush while Cincinnati averaged 3.4.
5. Check third downs
Cincinnati converted only three of 15 third downs. That made its long possessions difficult to finish.
6. Locate the turnovers
Do not stop at the turnover count. Ask where the turnovers occurred and what followed.
Baltimore’s fourth-quarter interception happened near the goal line and became a defensive touchdown.
7. Match individual stats to the scoring sequence
Chase’s 132 yards were impressive. Flowers’ 68 yards were less impressive statistically, but two of his catches directly produced Baltimore’s 14-0 halftime advantage.
That final step often reveals the real story.
Key Takeaways
- Baltimore won 24-0, but the game was not a simple yardage domination.
- Cincinnati had 18 first downs and 39:19 of possession, yet scored zero points.
- Baltimore gained 317 yards on only 40 offensive plays.
- The Ravens averaged 7.9 yards per offensive play, compared with 4.2 for Cincinnati.
- Derrick Henry rushed for 100 yards on only 11 carries.
- Lamar Jackson completed 8 of 12 passes for 150 yards and two touchdowns.
- Ja’Marr Chase caught 10 passes for 132 yards, but Cincinnati could not convert his production into points.
- Baltimore forced two interceptions, including the fourth-quarter turnover that became a defensive touchdown.
- Cincinnati’s defense recorded four sacks and intercepted Jackson once, showing that the Bengals were not simply beaten in every statistical category.
- The biggest difference was situational efficiency: Baltimore turned its opportunities into points while Cincinnati repeatedly failed to finish drives.
FAQ: Bengals vs Baltimore Ravens Match Player Stats
What was the final score of the Ravens vs Bengals game on December 14, 2025?
The Baltimore Ravens defeated the Cincinnati Bengals 24-0 at Paycor Stadium in Cincinnati. Baltimore scored 14 points in the second quarter, three in the third and seven in the fourth.
How did Lamar Jackson perform against the Bengals?
Lamar Jackson completed 8 of 12 passes for 150 yards, two touchdowns and one interception. He also rushed twice for 26 yards. His passer rating was 114.6.
How many yards did Joe Burrow have against Baltimore?
Joe Burrow completed 25 of 39 passes for 225 yards, with no touchdowns and two interceptions. His passer rating was 58.2.
Who led the Bengals in receiving?
Ja’Marr Chase led Cincinnati with 10 receptions for 132 yards. He also reached 100 receptions for the season during the game.
Who led the Ravens in rushing?
Derrick Henry led Baltimore with 100 rushing yards on 11 carries, including a 29-yard run. Keaton Mitchell added 66 yards on eight carries.
Why did the Bengals lose despite having more possession and first downs?
Cincinnati had more possession and first downs, but struggled on third down, averaging only 4.2 yards per offensive play. The Bengals also threw two interceptions, with the second occurring near the Ravens’ goal line and becoming a defensive touchdown.
Conclusion
The Bengals vs Baltimore Ravens match player stats show why a 24-0 score can hide a more interesting football story. Cincinnati controlled possession, gained 18 first downs and watched Ja’Marr Chase post 132 receiving yards, yet Baltimore was far more explosive with 7.9 yards per play and 189 rushing yards. Lamar Jackson and Derrick Henry supplied efficient offense, while the Ravens defense turned Joe Burrow’s two interceptions into the decisive difference — especially the fourth-quarter pick that became a 95-yard defensive touchdown. The rematch therefore was less about Baltimore having the ball more and more about Baltimore making far more of the opportunities it had.